
peak sap flow (J-max) data analysis and interpretation
A largely unexplored, but extremely important, physiological parameter in sap flow research is the time of day of peak sap flow (J-max). The J-max parameter is important because it provides insights into plant growth, carbon uptake, photosynthetic capacity, drought tolerance and many other physiological parameters.
J-max definition
The time of day when sap flow, or sap velocity, is at its maximum point. That is, at what time of the day is the maximum rate of sap flow. (Figure 1).
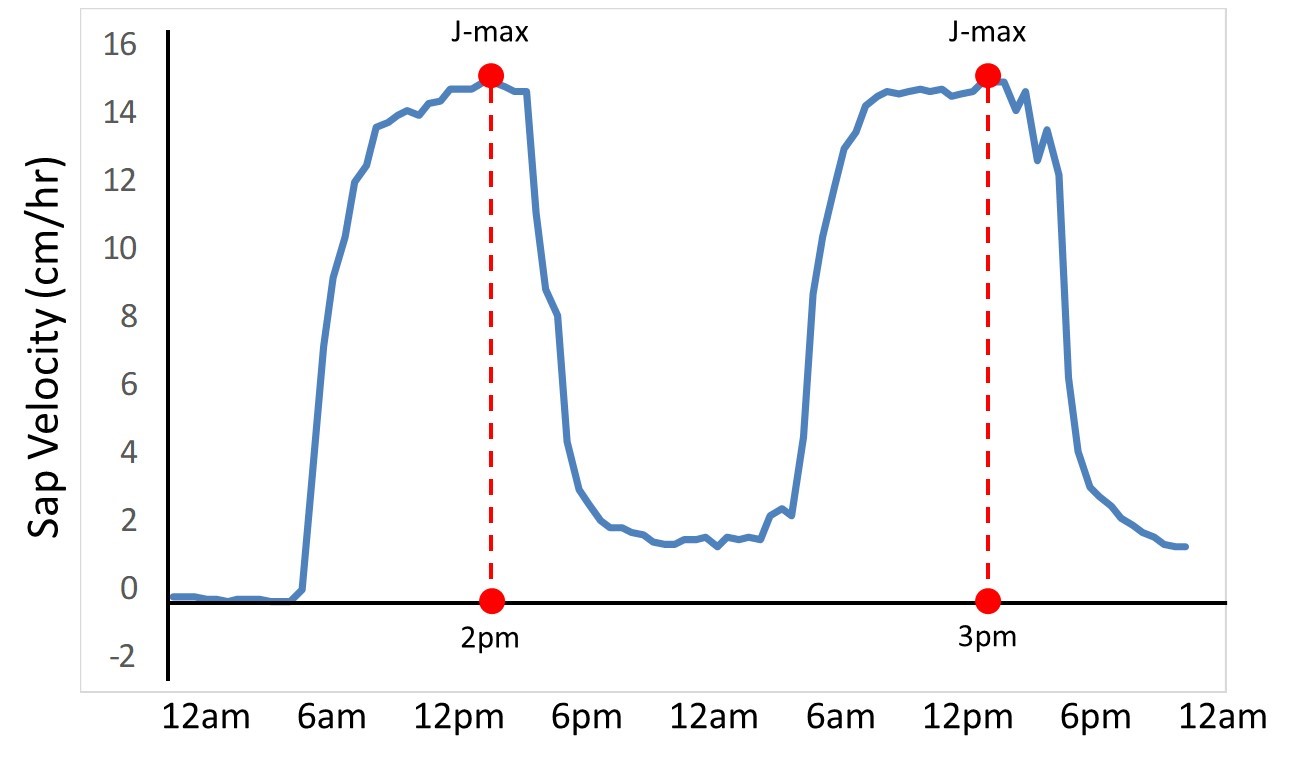
Figure 1. An example of J-max over two days of sap flow measurements. On these days, J-max occurred at 2pm and 3pm, respectively.
how to find J-max in your data
J-max will occur on any day as, by definition, there will be a maximum rate of sap flow over any diurnal period. However, to remove uncertainty or bias in the data, it is better to focus only on rain-free days or “normal” dry days (Figure 2). For example, J-max will generally occur around solar noon however if, by coincidence, there is a storm or rain around solar noon then this will affect when J-max occurs. When compiling data over a growing season, or several years, such interruptions to the diurnal course of sap flow will cause confusion, or errors, in the interpretation of data.
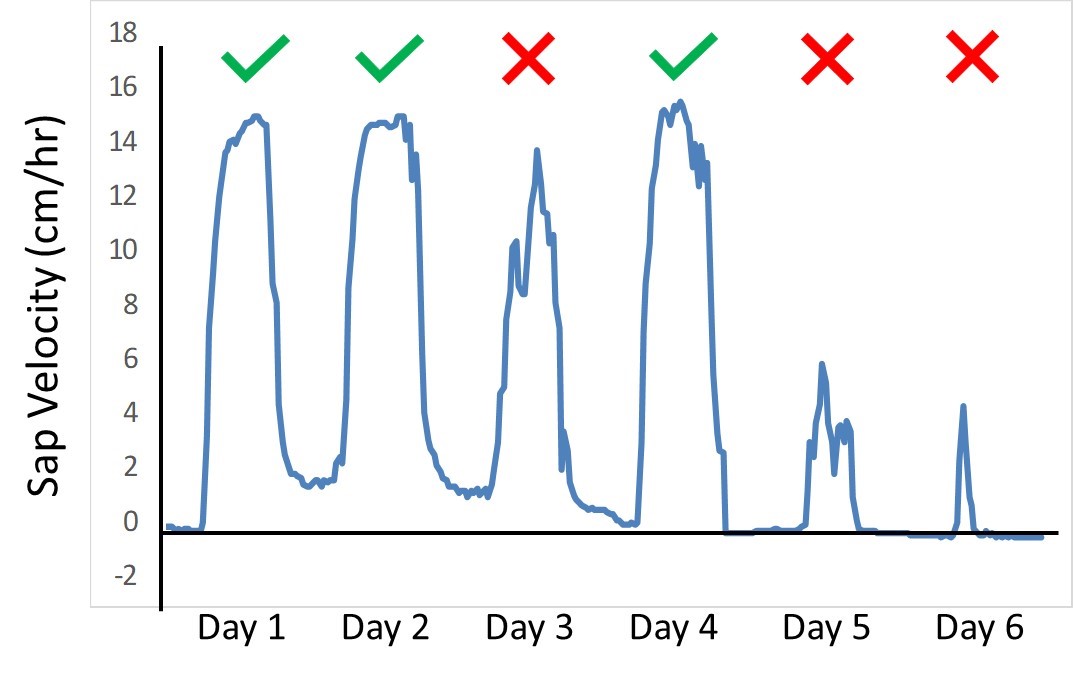
Figure 2. Sap flow data over six days of sun and rain. For J-max analysis, use data from days 1, 2 and 4. Remove days such as 3, 5 and 6 from the data set as these days with rain, heavy fog, or unusual weather, may lead to misinterpretation of data.
For ease of analysis and data interpretation, it is better to bin, or categorise, J-max over an hourly or half hourly period. For example, J-max may occur at 12.23pm but this can be categorised into 12pm or 12.30pm. Most sap flow data are recorded at 15, 30 or 60 minute intervals so it should be relatively easy to arrange the data in this way.
The data should be collated over a meaningful period for instance: seasonal patterns (e.g. spring v summer; dry season v wet season); growth periods (e.g. vegetative phase v flowering phase); treatments (e.g. irrigation v drought treatment); etc.
As with any statistical analysis, the more data that can be collated means the more powerful and meaningful the interpretation of those data. For example, one week of data will not be very useful but one month or one growing season will provide greater insights into the physiology of plants.
- Sap flow sensors and monitoring systems
- Sap flow methods explained
- The importance of sap flow sensor calibration
- Stem water content measurements
- Dendrometers for trees, small stems and fruits
how to graph, or present, J-max data
A histogram, or frequency, diagram is the best approach to graphing or presenting J-max data (Figure 3). The x-axis should display time of day. The y-axis should display count, or frequency, data.
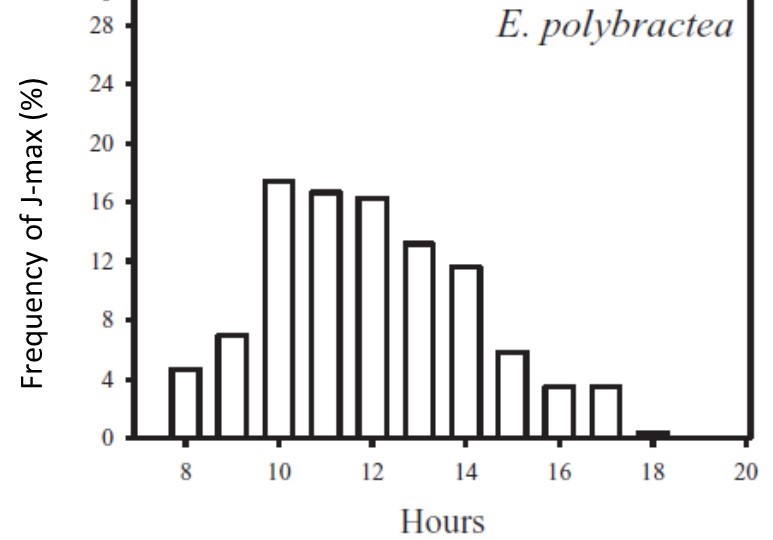
Figure 3. An example figure of how to present J-max data in a frequency histogram. Figure is adapted from Figure 4 of Doronila and Forster (2015).
interpretation of J-max data
There has been minimal research on J-max therefore its physiological significance is unknown. However, a general assumption is that J-max is correlated with stomatal behaviour. If J-max occurs early in the day, then (presumably) plants are undergoing stomatal closure. If J-max occurs later in the day then stomata remain open for longer. This hypothesis can be easily tested.
A null hypothesis may be for J-max to occur at solar noon. This is generally the time of day when the biophysical factors driving sap flow are at a maximum. If J-max diverges from solar noon, then physiological or environmental causes can be determined. However, there has been minimal research on J-max therefore a null, standard or normal pattern of J-max is currently unknown.
Interpretation of data will be easier if experimental treatments or different species are compared. If J-max occurs earlier, or later, in one treatment or species then causal factors will be easier to determine.
the importance of J-max
Differences in stomatal opening or closure will have ramifications for carbon uptake and water loss. For example, in plants where J-max occurs later in the day growth rates may be higher, due to the longer period stomata are open for the uptake of CO2 and photosynthesis, but so will water loss. This is a testable hypothesis by obtaining additional data on plant growth, photosynthesis and transpiration.
J-max also provides a parameter to test the tolerance of plants to various stresses. For example, under a drought treatment, a plant with J-max later in the day will have a greater tolerance to drought than a plant with an earlier J-max. Selection of crops for their stress tolerance can also be undertaken based on the J-max parameter.
an example publication presenting J-max data
Doronila and Forster (2015) presented J-max data of three Eucalyptus species growing in a common garden over a summer period. J-max for E. cladocalyx was approximately 1pm, whereas the other two species had a J-max at 10am. During the study, the plants experienced heat wave conditions and it was shown that E. cladocalyx had a greater tolerance to the extreme temperature and VPD conditions than the other two species. Additionally, anecdotal evidence suggested that E. cladocalyx had higher growth rates possibly due to the difference in J-max.
Reference: Doronila and Forster (2015). Performance measurement via sap flow monitoring of three Eucalyptus species for mine site and dryland salinity phytoremediation. International Journal of Phytoremediation, 17, 101-108.
further research is needed
J-max is an easy parameter to extract from just about any sap flow data set and it potentially has many important physiological implications. However, research on J-max is scarce.
Some questions that need answering include, but are certainly not limited to, the following:
- why do different species have different J-max?
- is J-max only related to stomatal behaviour? Does stem capacitance, hydraulic conductivity, etc, play a role?
- what is the relationship between J-max, isohydric and anisohydric behaviour?
- do species only display a uni-modal J-max? Or is it possible to have a bi-modal or multi-modal or non-modal J-max? What does this mean for plant physiology?
- is there a consistent seasonal, biogeographical or global pattern of J-max?
For more information on J-max, or assistance with your analysis, contact the sap flow scientist at Edaphic Scientific: info@edaphic.com.au