


dendrometers explained....
 what is a dendrometer?
Dendrometers are precision sensors that can measure the growth of plants.
Specifically, dendrometers are used by researchers, growers and foresters to measure the growth of a stem, trunk, branch, roots or fruits over time.
In its simplest form, a dendrometer can be a tape measure, or ruler, that is wrapped around the trunk of a tree or a fruit. Known as a manual dendrometer if left in place over time, such a meter can be read daily, weekly or monthly to record plant growth.
More commonly, a dendrometer is an automated meter, connected to a data logger, that is either a band dendrometer or point dendrometer.
Dendrometers are sometimes referred to as pressure transducers or linear voltage displacement (LVDT) sensors.
related article
Watch a You Tube video of a Fruit Dendrometer installed on a mango:
A band dendrometer consists of a stainless steel band that is tightly wrapped around the circumference of a tree’s trunk. The band is connected to a tightly wound spring where the expansion and contraction of the spring is detected as a voltage and measured as plant growth. Due to the difficulties in accurately installing and maintaining band dendrometers, as well as issues with thermal influences on the stainless steel band leading to errors in measurement, Edaphic Scientific does not recommend their use.
A point dendrometer can come in many forms but, as the name suggests, it measures a single point, or surface area, of a stem or fruit rather than being wrapped around. For tree trunks, or large stems, point dendrometers consist of two rods: one that is drilled into the stem for stability and the second that is tightly placed against the xylem of the stem. The second rod is connected to a linear voltage displacement transducer (LVDT) where an expansion and contraction of the stem is recorded as a small change in voltage. The change in voltage is then correlated with stem circumference changes.
The second type of point dendrometer is more suitable for small stems, petioles and fruits. These dendrometers also work off a LVDT measurement principle, however rather than consisting of two rods it consists of a bracket, or brace, that is firmly attached to the plant.
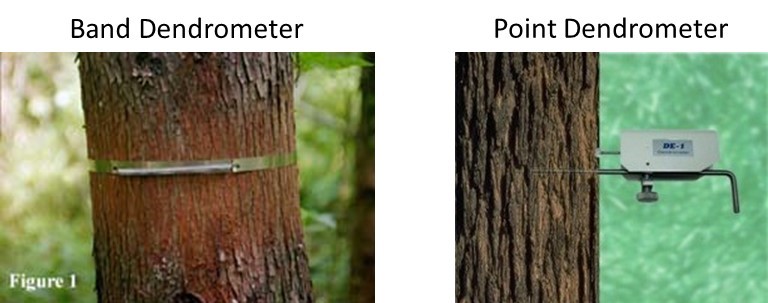
An example of a manual band dendrometer (right hand side, image source: USDA) and a LVDT point dendrometer.
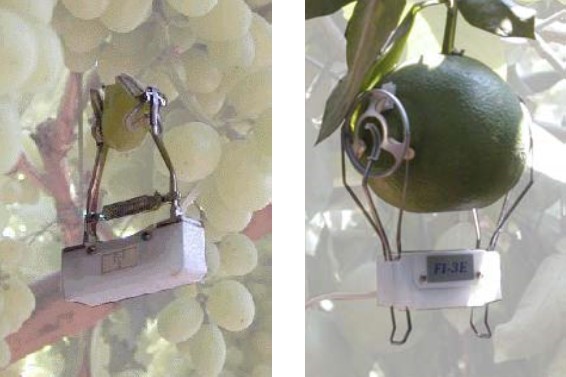
Examples of point dendrometers installed on fruits.
why are dendrometers important?
 Dendometers provide invaluable information over long and short time periods. Over weeks, months, seasons and years, dendrometers provide information on the dynamics of plant growth, biomass allocation and carbon uptake. Over a 24-hour period, automated and high precision dendrometers can even provide data on the diurnal dynamics of plant and fruit physiology.
Over long time periods, such as weeks, months, seasons and years, dendrometers record carbon uptake and storage. This information can be used to assess carbon stocks and offsets for climate change mitigation. Important economic plant species for agriculture, horticulture and forestry can be measured with a dendrometer over the long-term to determine their response to environmental, irrigation or nutrient treatments, or to assess whether they are a suitable species for stressful environments such as drought and heatwaves.
Plants, like animals, breathe throughout the day. Unlike animals, who take rapid breathes over the time period of seconds, plants essentially take one breath in and out over a 24-hour period. Typically, at sunrise or dawn, the stomata of plants open to release water and oxygen and to uptake carbon dioxide. During this period, a contraction of plant tissues occurs due to the negative water potential caused by water loss. Late in the afternoon, or in the early evening, the stomata begin to close and there begins an expansion of plant tissues as cells begin to refill with water.
Below, we provide more information on how the daily dynamics of plants, as measured by dendrometers, provides vital information for researchers and growers.
an example of dendrometer data
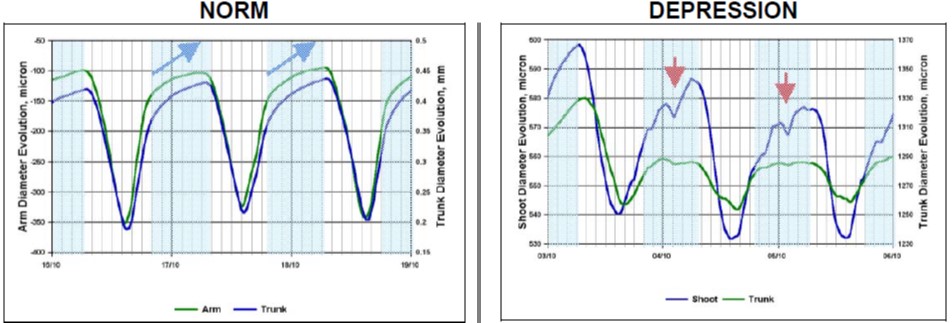
Continuous measurements of tree or fruit growth with dendrometers typically show a diel cycle with maximum values around sunrise and minimum values around the middle of the afternoon. Or, in other words, dendrometers, over a 24 hour cycle, typically show day-time contraction and night-time expansion. The following figure shows "normal" dendrometer data (left-hand side) and "non-normal" dendrometer data (right-hand side). Any night-time contraction is generally considered as an indicator of a physiological disorder or stress.
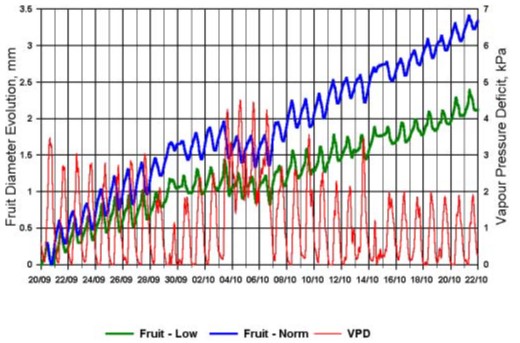
Longer term data can be used to compare experiment treatments. For example, the following graph shows avocado fruit growth under two irrigation regimes: normal (blue line) and 70% less than normal (green line). The red line represents atmospheric conditions, or Vapour Pressure Deficit (VPD). The dendrometer data clearly show that the avocado receiving the normal irrigation treatment is growing faster and bigger than the 70% less treatment.
MDS – maximum daily shrinkage
Although high resolution data measured by dendrometers at, say 10 or 15 minute intervals can be correlated against other variables, such as soil moisture, sap flow, solar radiation or vapour pressure deficit, an important parameter often used by dendrometer researchers is MDS – the maximum daily shrinkage.
MDS is simply the difference, over a diurnal course of measurements, between the highest and lowest dendrometer measurement. Or, in other words, MDS is the difference in stem circumference when the stem was full expanded minus when the stem was fully contracted over the course of a single day.
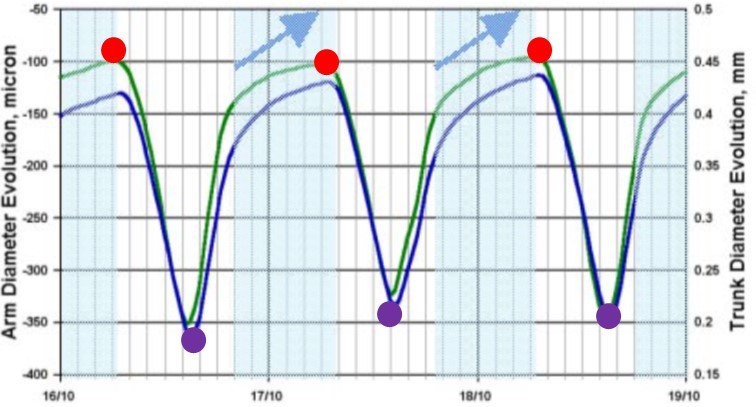
In the following graph, the maximum daily value is represented by the red circles and the minimum daily value is represented by the purple circles. The MDS is the red circle minus the purple circle.
Researchers have correlated MDS to a large range of physiological and abiotic parameters including soil moisture, soil water potential, stomatal conductance and stem water potential. The MDS is an excellent statistical variable to concisely compare experimental subjects against various treatments. For example, Kopt and Ton (2005) measured stem variations in grapevines over a 7 year period and found that there was a dramatic effect of night air dryness on water status of well-irrigated vines.
Many researchers have tested whether the MDS can be used as a surrogate for plant water potential. Continuous measurements of plant water potential is difficult and most researchers rely on time consuming, and destructive, leaf water potential measurements with plant water status consoles. Although these plant water potential instruments are extremely accurate and reliable, continuous measurements is sometimes preferred by researchers. Testing this hypothesis, Ortuno et al (2010) found that the MDS, and dendrometers in general, cannot be used as a substitute for plant water potential measurements. Although they found a negative linear correlated between MDS and plant water potential, the relationship became curvilinear as the plant became drier and more water stressed. For example, olive trees had a water potential of approx. -0.8 MPa and an MDS of 0.4 mm. But, when the species was more water stressed, and had a water potential of -3 MPa, the MDS was still 0.4 mm. Therefore, if the MDS value was 0.4 mm, we cannot truly know that the plant has a healthy water potential of -0.8 MPa or a highly stressed water potential of -3 MPa.
environmental measurements and interpretation of dendrometer data
Dendrometer measurements, like other plant physiological measurements, should not be considered in isolation of environmental variables. When installing dendrometers, Edaphic Scientific recommends that a weather station, at the very least, and additional abiotic parameters, such as soil moisture or water potential, are measured.
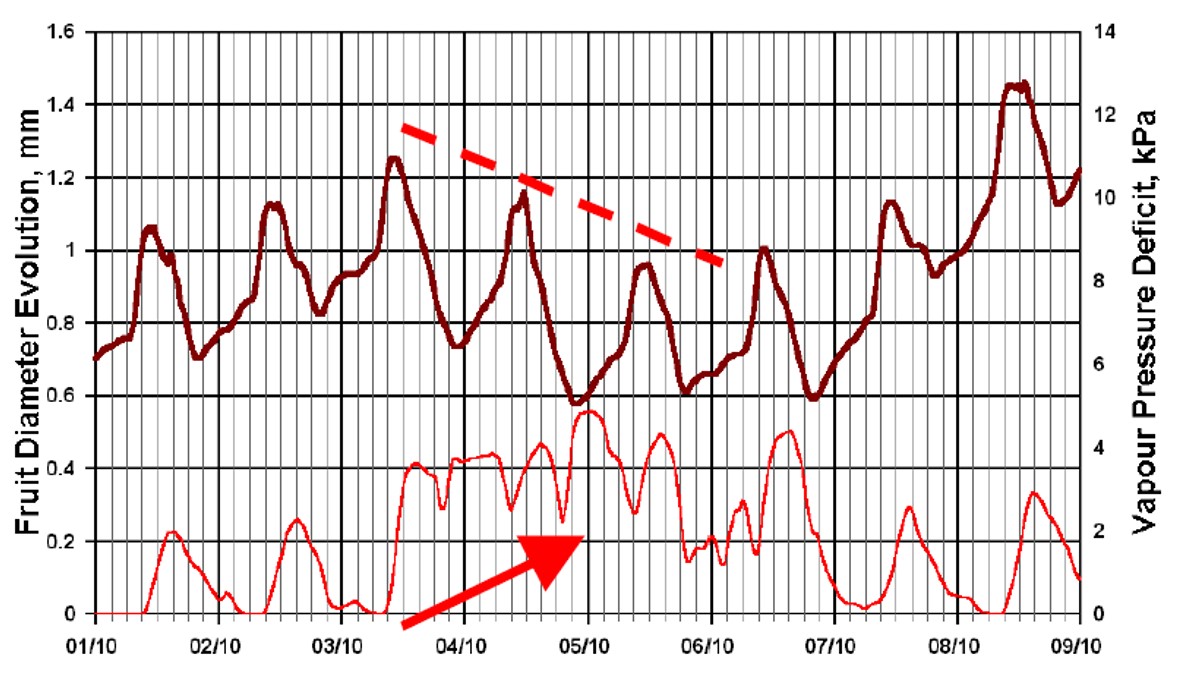
An example of where environmental data provided useful information for dendrometer data interpretation comes from a grapefruit grower in Israel. The graph below shows dendrometer measurements on a grapefruit over a nine-day period. The brown, solid line represents fruit dendrometer measurements and the red, solid line represents Vapour Pressure Deficit (VPD). When VPD was low, grapefruit growth increased. During the middle of the measurement period, VPD was high – particularly during the night. Over this time, the grapefruit actually decreased in size suggesting a loss of solutes either to the environment or back into the branch of the tree.
irrigation and dendrometers
When to commence irrigation?
Soil moisture and water potential sensors are usually installed at a single point, or profile, in the soil. These sensors are excellent at monitoring soil moisture however they provide little direct information on plant water status. Additional information, such as refill and field capacity points, or saturated and wilting points, is required in order to accurately interpret data.
Dendrometers can provide direct information on when irrigation is required. That is, a dendrometer can suggest it is time to commence irrigation but they cannot provide information on how much (i.e. litres or mm per hectare) that is needed.
An example of how dendrometers can be used for irrigation timing is at the start of the growth season for deciduous crop species such as grapevines. The figure below shows dendrometer measurements from the start of the growth season, in the northern hemisphere, for a Cabernet-Sauvignon grapevine variety. During May the dendrometer records a steady increase in stem growth. Throughout this period, there is no need for irrigation. By the first week of June, growth starts to decline or plateau.

The next figure below shows a close-up of the June data. The green, solid line is the trunk dendrometer measurements and the red, solid line is Vapour Pressure Deficit (VPD). The blue, dashed line indicates where growth is steady and increasing; whereas the red, dashed line indicates where growth is declining due to soil moisture deficit. An irrigation event on the 07/06 returns the grapevine to steady growth.

If a grower was only relying on soil moisture data, they may have irrigated throughout the month of May when the plant did not require any additional water. By directly measuring the plant, this grower was able to save money and water resources and irrigation expenses.
When is the best time of day for irrigation?
Dendrometers can be used to examine the effects of irrigation scheduling at different times of the day. For example, our grapevine grower was irrigating his crops at midnight and then decided to shift irrigation to 10am. The results of the decision are shown in the following graph. In the left-hand graph, the blue, solid line is grape berry dendrometer measurements; the black, solid line is soil volumetric water content; and the red, solid line is VPD. In the right-hand graph, the green, solid line represents the trunk dendrometer measurements.
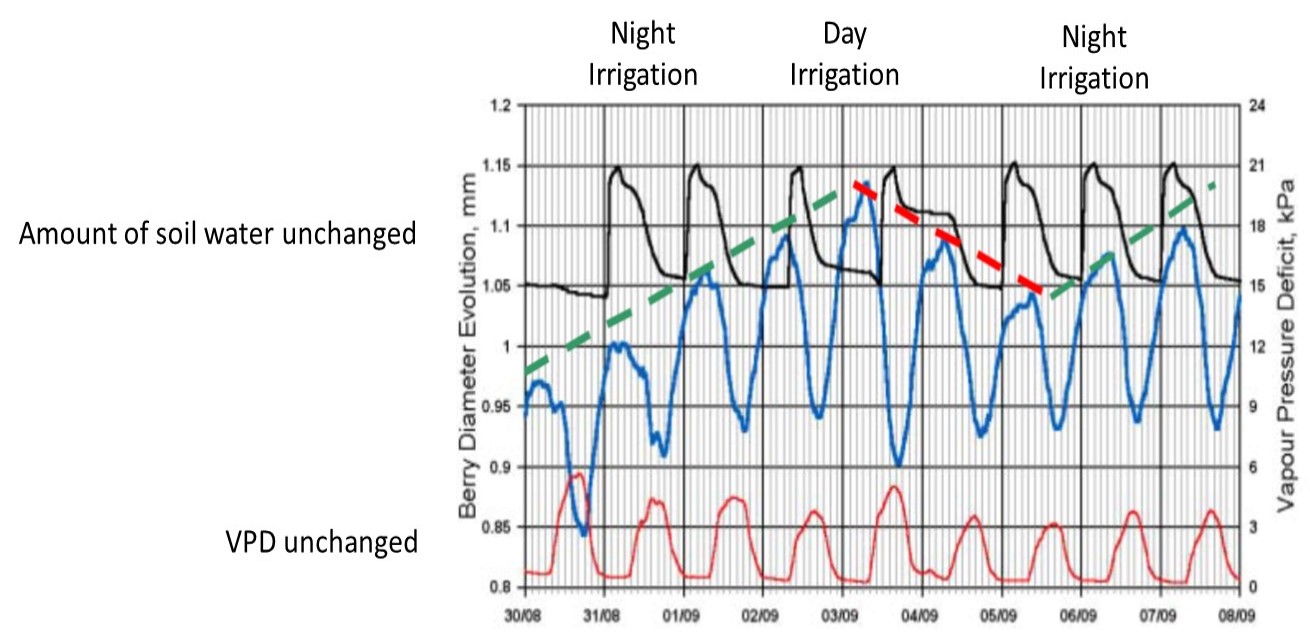
Throughout the measurement period, VPD does not change appreciably therefore the change in dendrometer measurements cannot be attributed to atmospheric drivers. Also, the total amount of irrigation, as demonstrated by soil moisture content measurements, did not change. The only variable to change was time of day of irrigation.
Switching irrigation to the morning period had a negative effect on both berry and trunk size. When the grower switched irrigation back to the night-time period, berry and trunk growth started to increase.
dendrometers and climate change
The Smithsonian Institute is monitoring tree growth, using manual band dendrometers, and relating this information to how trees respond to climate change (note: Edaphic Scientific is not affiliated with this project. This video is uploaded on our website for your interest only).